Your "One-Stop-Shop" for your next Embedded Project

Stacks Image 17298

Reveal the runtime world with Tracealyzer

Boost your software development


Tracealyzer gives an unprecedented level of insight into the run-time world of embedded software. Solve complex software problems in a fraction of the time otherwise needed, develop more robust designs to prevent future problems and find new ways to improve your software’s performance.

Percepio_Logo.jpg

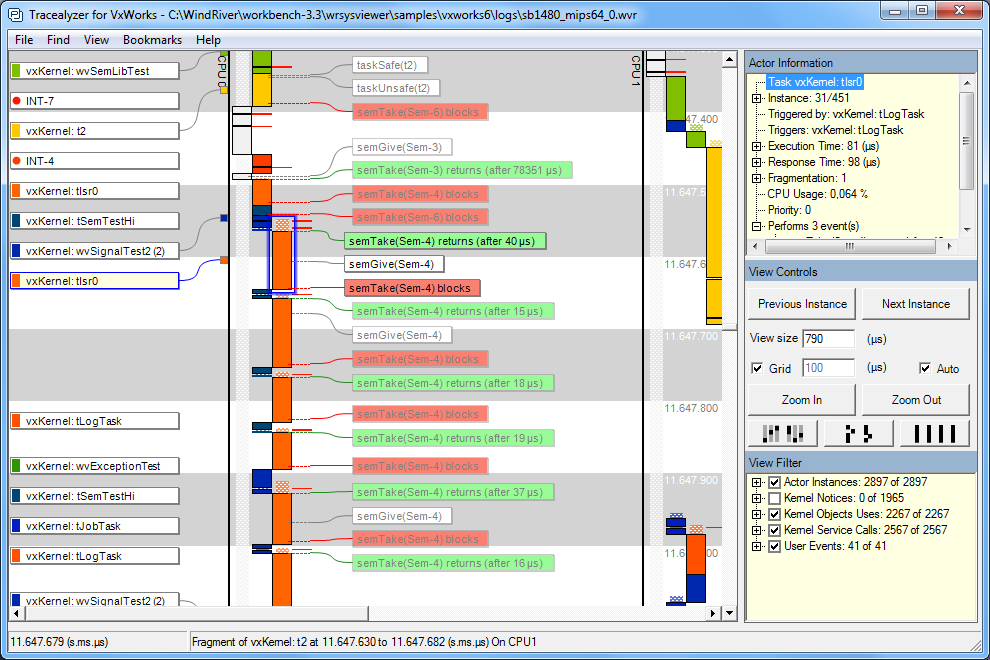
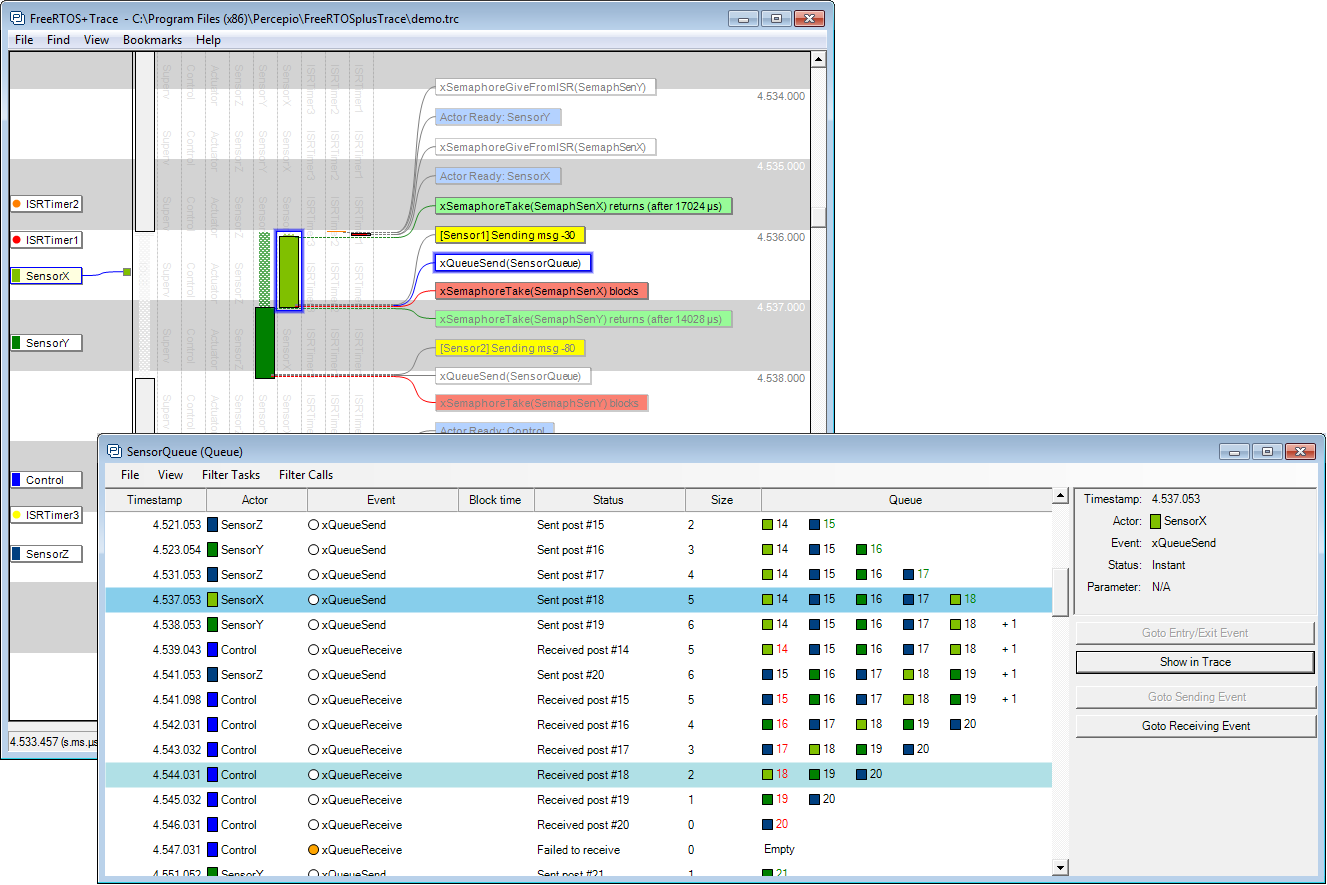
When developing embedded software based on an operating system, a traditional debugger is often insufficient to fully understand the software’s run-time behavior. A debugger shows the current system state and allows you to step through the program, but a tracing tool is needed for studying the real-time interactions between threads and the operating system.

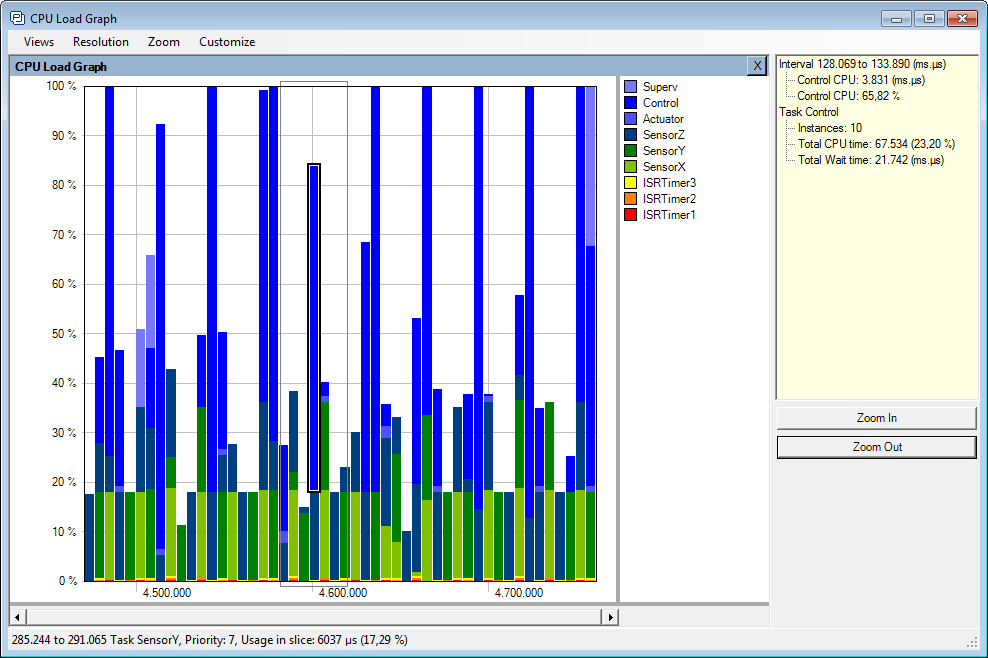
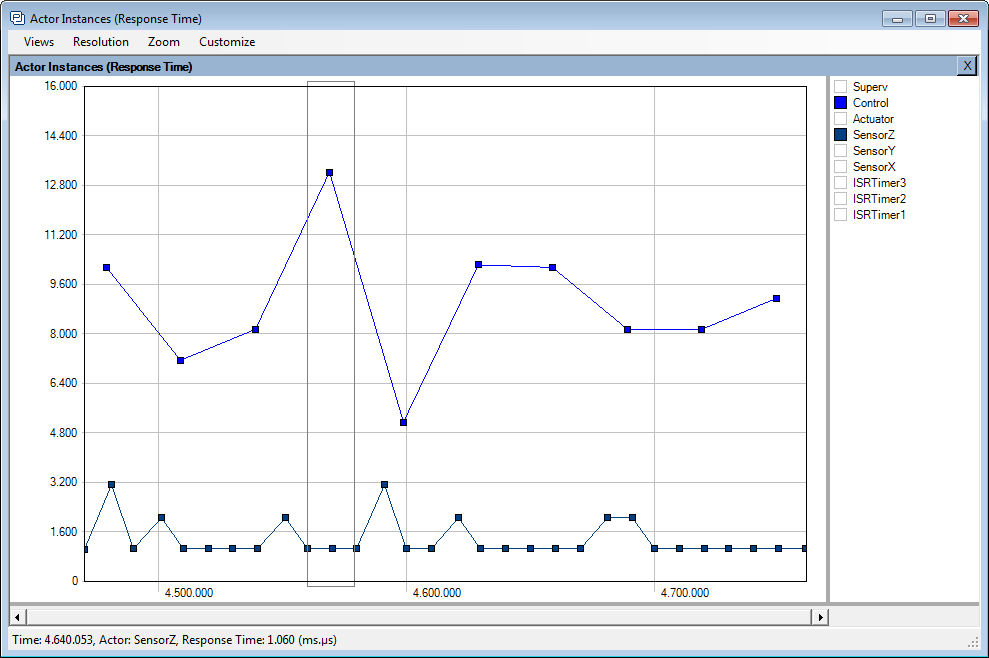
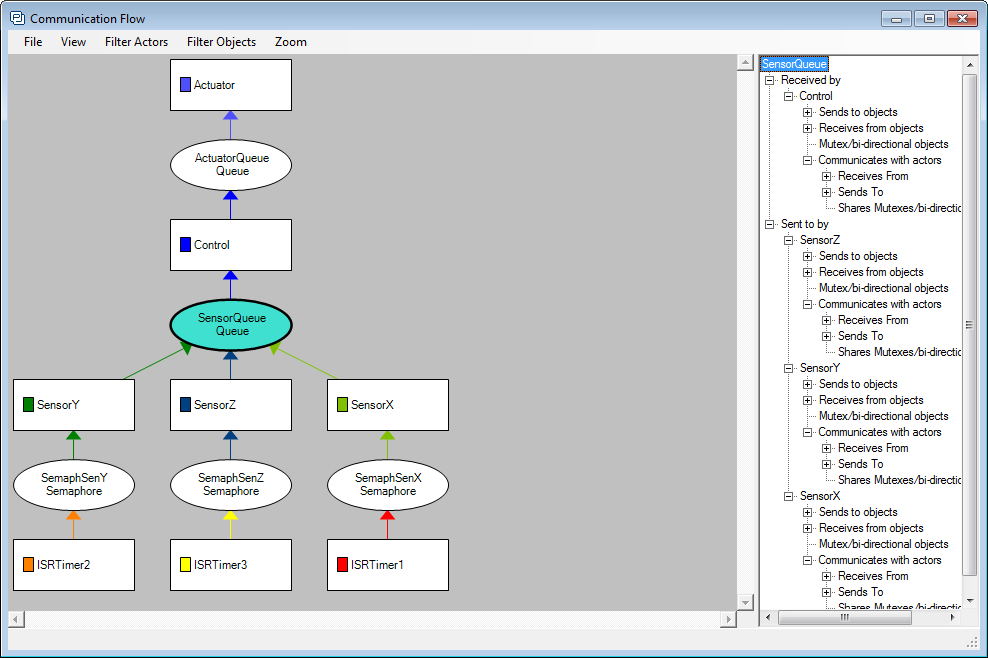
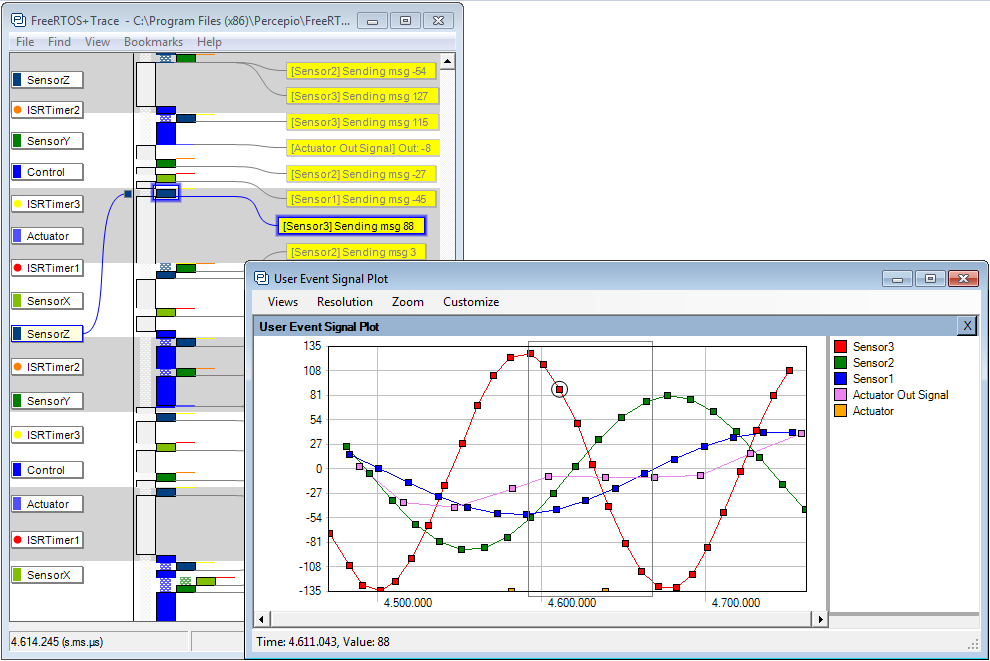
Tracealyzer visualizes traces from your embedded software through more than 20 high-level views that complement the debugger perspective with the “big picture” and with several specialized perspectives that makes it easier to reveal anomalies. The views are interconnected in clever ways and intuitive to use.

Tracealyzer provides an unprecedented insight into the run-time world for your developers, giving your software development several high-level benefits. Solve complex software problems in a fraction of the time otherwise needed, develop more robust software designs and find new ways to improve your software’s performance. For a quick preview, watch this video showing the FreeRTOS version.

Download Tracealyzer Data Sheet.

The Tracealyzer Product Family

FreeRTOS
Tracealyzer for FreeRTOS RTOS
VxWorks
For WindRiver VxWorks v5.5 and later
Keil RTX5
Tracealyzer for Keil RTX5 RTOS
On Time RTOS-32
Tracealyzer for On Time RTOS-32
Linux
General Linux and WindRiver Linux
Micrium uC/TRACE
Tracealyzer for uC/OS-III
Azure RTOS ThreadX
Tracealyzer for Azure RTOS ThreadX
OpenVX / Synopsys EV6x
Tracealyzer for OpenVX / Synopsys EV6x
PX5 RTOS
Tracealyzer for PX5 RTOS
ZEPHYR RTOS
Tracealyzer for ZEPHYR RTOS
Bare Metal / SDK
Tracealyzer for Bare Metal / SDK
SafeRTOS
Tracealyzer for SafeRTOS

Some of the Tracealyzer versions are provided by Percepio and others through our partners. Follow the link to learn more about the Tracealyzer product for your embedded operating system. See also the the partner page for information on other collaborations and upcoming products.

Tracealyzer visualize traces from a lightweight software recorder that hooks into the operating system, so you don’t need any special trace debugger to use Tracealyzer. This makes Tracealyzer more than just a lab tool, as the recording can deployed in field use. Some of our customers have the recording active by default in the release build, and thereby get very valuable trace diagnostics on real-world issues, that otherwise would have been hard to analyze.

We at Percepio are unique in our focus on trace visualization for embedded software. Combined, the team has 15 years of experience in this area and since trace visualization is our specialty, the insight offered by Tracealyzer is on a new level compared to other tools. For a quick preview, watch this VIDEO showing the FreeRTOS version.

Scheduling, Interrupts, System Calls and User Events

The main trace view shows you all recorded events visualized on a vertical time-line, including task execution timing, interrupts, system calls and custom user events. The task and interrupt trace are shown as colored rectangles. Events are shown as floating text labels. Zooming is very easy using a click-and-drag selection, which also works as a measurement tool. Tasks and events can be clicked and highlighted for additional information, including timing and event dependencies. The lower right corner contains a powerful filter, and the Finder dialog provides even more powerful filters. When zooming out, this view naturally transforms into an overview where patterns can be studied.

CPU Load

This view presents a horizontal time-line showing the total CPU usage, and also CPU usage per task/interrupt. The CPU Load Graph allows for navigating the main trace view, since a double click in the CPU Load Graph focuses the main trace view on the clicked interval. Zooming is allowed in this view as well, independently of other views, and filters are available for focusing on individual tasks or interrupts.

Timing Variations

This is an example of several Actor Instance Graphs, each showing the distributions of a specific timing property for an actor, i.e., a task or interrupt routine. This includes execution time, response time, fragmentation, and several others. Each data point represents one specific execution of a task or interrupt handler. This graph, Response Time, shows the variation in response times for two selected tasks. Tasks instances with high response times may reveal resource conflicts, e.g., where several tasks or interrupts compete for CPU time in a busy interval. This view makes it easier to spot such locations that may indicate problems or possibilities for optimization.

Multiple Views Synchronized

All views with horizontal orientation can be combined in a single parent window, with synchronized scrolling. This includes most views except the main trace view, but the task and interrupt trace is available as a horizontal view as well. In this example, a horizontal execution trace is shown together with an execution time plot and the CPU Load Graph. Combining views like this allows for spotting patterns that otherwise would be hard to see using individual views, e.g., how the response time depends on other events, and this also allows for greater customization of the user interface.

Communication Flow

Many system calls allow for communication or synchronization between tasks. Tracealyzer understand these dependencies and the Communication Flow graph is a summary of all such dependencies found in the trace, in the form of a directed graph. This is a high-level view of the communication dependencies between tasks and interrupts, including the kernel objects used such as semaphores and message queues. Like in all views, double-clicking on a node opens a related view focused on the particular object. Double-clicking on a kernel object (e.g., a semaphore) opens the Object History view (shown below), a list of all events on the specific kernel object. If double-clicking on a task or interrupt, the Actor History view is opened showing all executions of the actor.

Kernel Object History

This view shows all events on a particular kernel object, such as a message queue, semaphore or mutex. The events are presented as a list, and double-clicking on a list item shows the corresponding system call in the main trace view. For message queues and similar objects with send/receive operations, it is possible to follow a specific message from send to receive, or vice versa, and also to inspect the messages (by sequence number) in the queue at any given time.

User Events and Signal Plots

This view shows all events on a particular kernel object, such as a message queue, semaphore or mutex. The events are presented as a list, and double-clicking on a list item shows the corresponding system call in the main trace view. For message queues and similar objects with send/receive operations, it is possible to follow a specific message from send to receive, or vice versa, and also to inspect the messages (by sequence number) in the queue at any given time.


Tracealyzer allowed me to quickly understand and solve serious multi-threading issues, that otherwise would have taken least two weeks to analyze. I got started and solved the first issue in a single day. I strongly recommend Percepio’s tracing tools.
Chaabane Malki, Embedded Systems Engineer, CGX Aero
In today’s tough competition with time-to-market pressure constantly increasing, visualization support is natural for software developers in order to produce software of higher quality, in shorter time and at a lower cost. We choose Tracealyzer from Percepio.
Jörgen Appelgren, R&D Manager, Atlas Copco Rock Drills