
🟠 Percepio Tracealyzer
Deep Visual Insight into Embedded Runtime Behavior
Percepio Tracealyzer provides powerful visual runtime analysis for embedded and real-time software. As the UNDERSTAND component of Percepio's Continuous Observability approach, it helps developers analyze complex system interactions, timing and performance - and investigate the root causes of difficult software problems.
Simplify Debugging and Understand Runtime Behavior
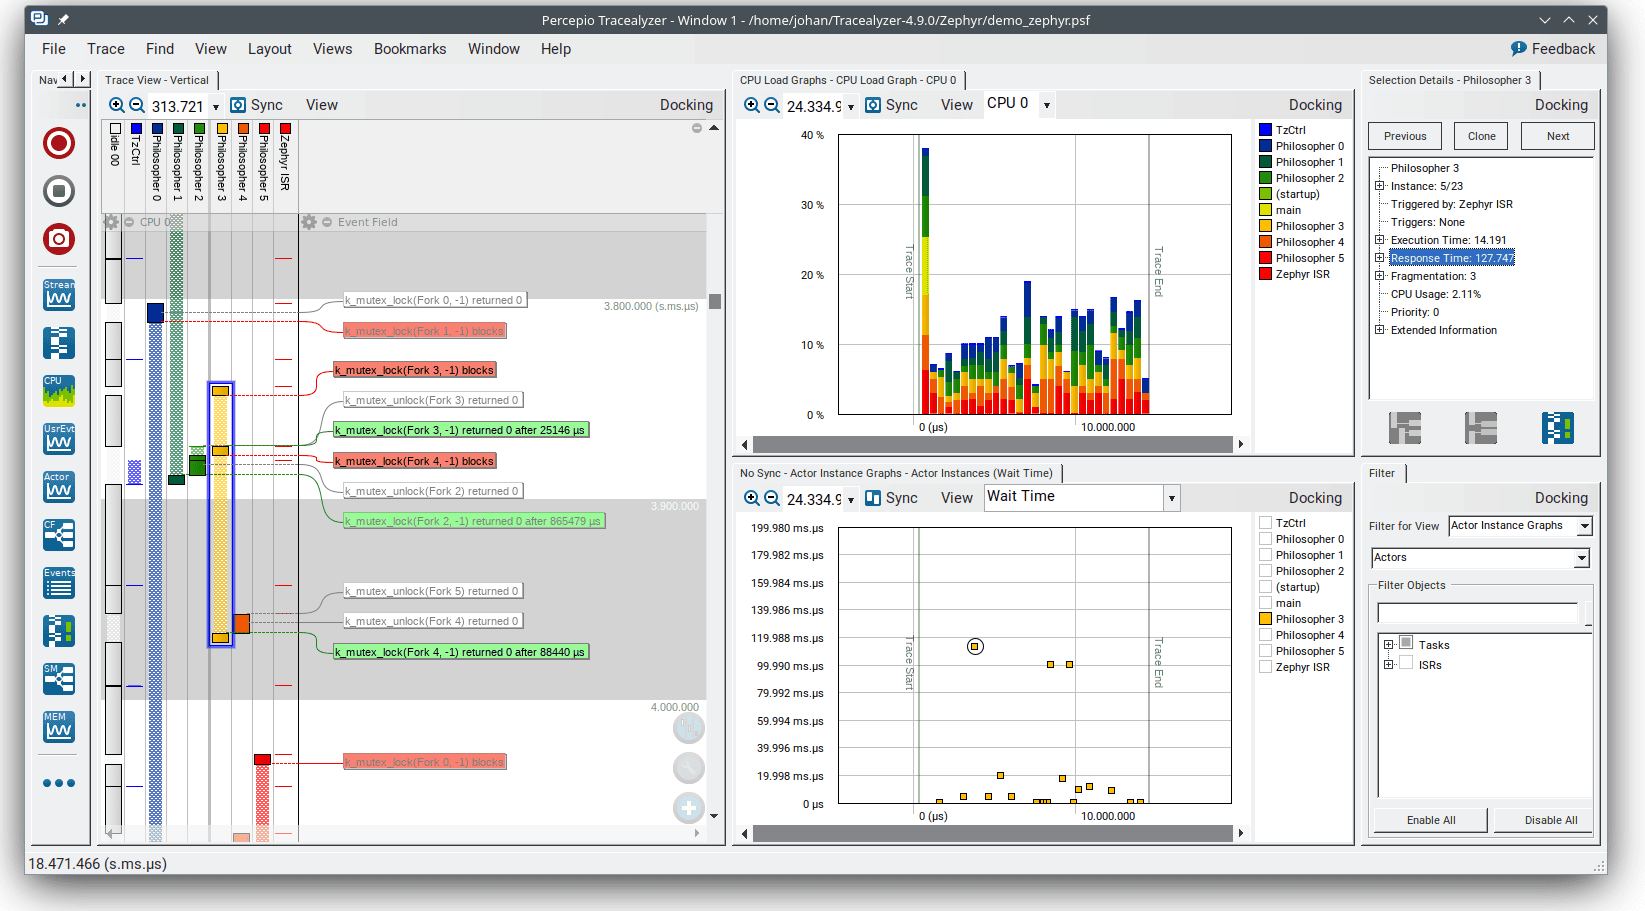
Complex embedded and real-time systems can exhibit problems that are difficult to understand using source-level debugging alone. Timing dependencies, task interactions, interrupts and other runtime events may all contribute to unexpected behavior.
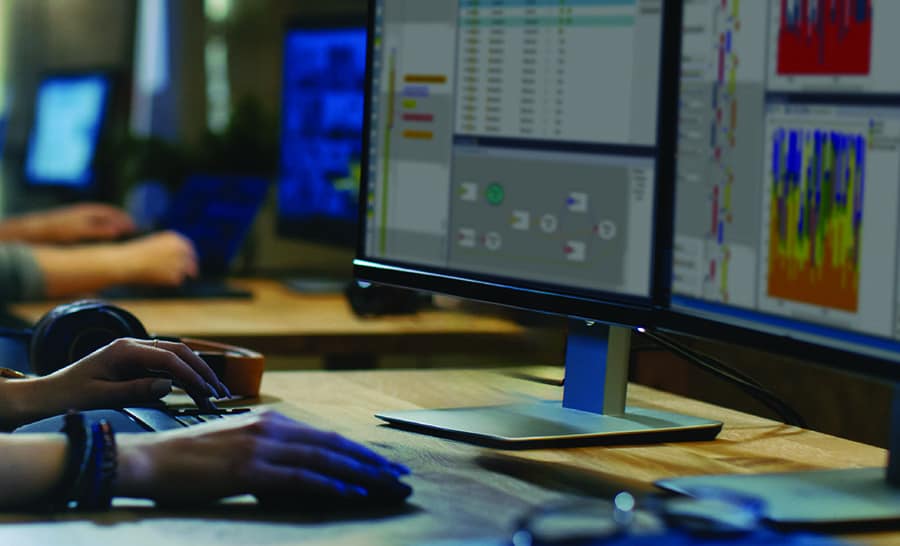
Tracealyzer complements traditional debugging by visualizing what actually happens while the software is running. Developers can explore system events over time, identify unexpected interactions and investigate the sequence of events leading up to a problem.
=> Features and capabilities
=> Learn how Tracealyzer simplifies debugging.
Optimize System Performance
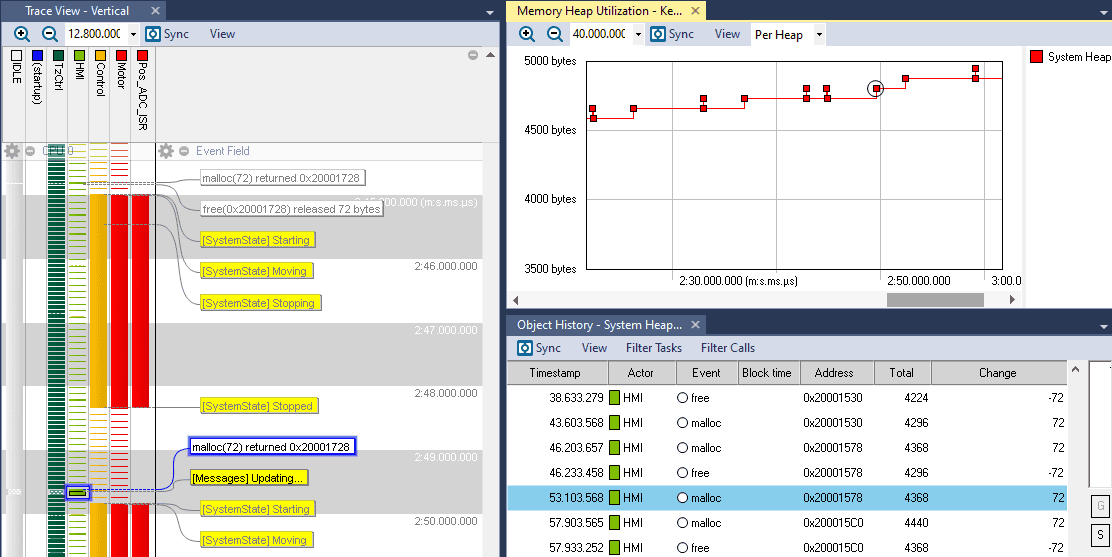
Tracealyzer provides profiling views that connect performance metrics with the runtime events behind them. This helps developers identify bottlenecks, investigate timing behavior and understand why particular tasks or threads are not performing as expected.
=> Features and capabilities
=> Free Trial - Get started today
"We've tried Tracealyzer for FreeRTOS and, I have to admit, we have been impressed. We've immediately found a bug and then discovered a troubling area in our code.
— Simonas "Simon" Greicius, Software Group Manager,
MGF Light Conversion, Vilnius, Lithuania
"In less than 5 days from running the tool, we improved the performance of our graphic rendering engine by 3x."
- Terry West, CEO, Serious Integrated, Inc.
“Tracealyzer has doubled our development speed. Problems that otherwise would take days to solve are obvious with this tool and just a quick fix. We use it all the time.”
— Alex Pabouctisids, Lead Firmware Engineer, Flyability.
Watch the Brief Introduction (2 min)
How It Works - From Events to Insight
Percepio Tracealyzer visualizes the behavior and timing of embedded software based on a software tracing library added in the target system. This uses lightweight instrumentation through existing RTOS hooks to capture key events such as task switches, kernel API calls, blocking, timeouts and more. There is also a C API for custom logging ("user events") that lets you extend the tracing to log variable values and other debug events.
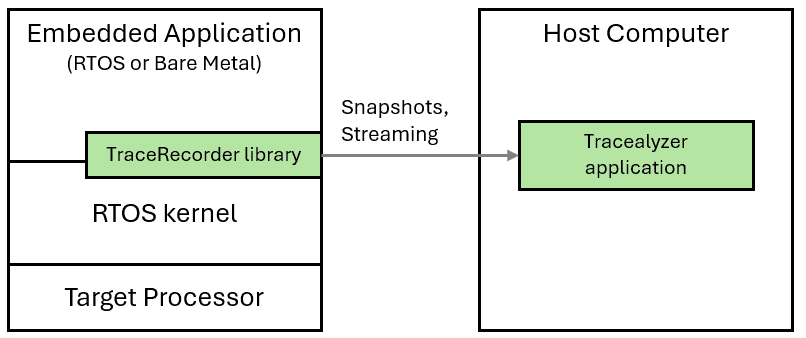
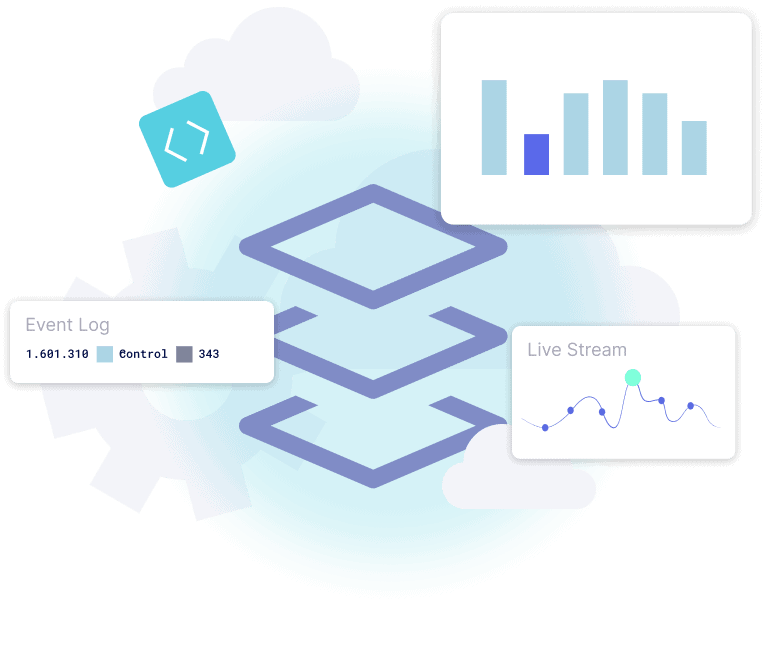
The trace can be explored visually in Tracealyzer using various graphical views and analytics for debugging, profiling and anomaly detection, including CPU load graphs, stack and heap memory usage, and timing plots. Tracing can run as continuous live streaming or as in-memory snapshots to capture critical moments leading up to a problem.
Tracealyzer is software-based and does not depend on a dedicated hardware trace port. Depending on the target and development environment, trace data can be transferred using different methods and can benefit from fast debug probes such as SEGGER J-Link for continuous trace streaming.
Bare-Metal, RTOS and Linux
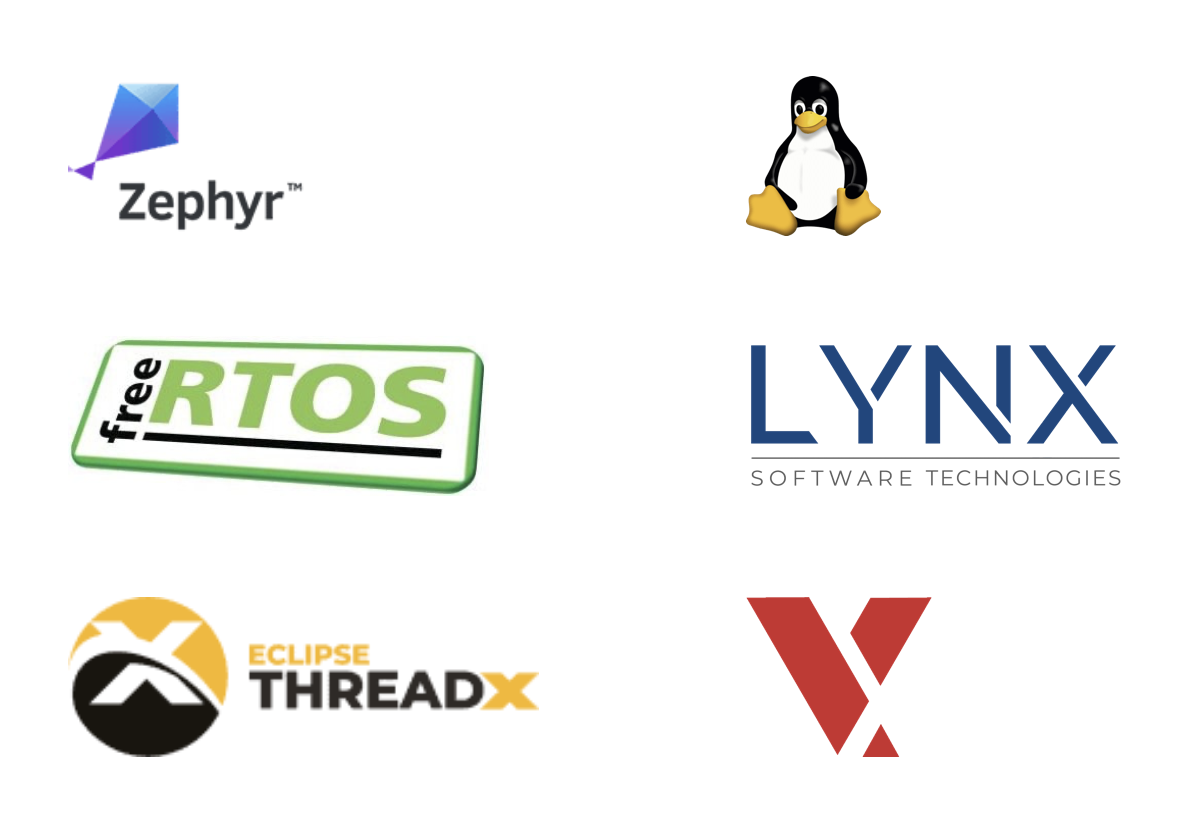
Tracealyzer provides prepackaged support for many popular embedded operating systems and RTOS kernels, including FreeRTOS, Zephyr, ThreadX, PX5 RTOS, SafeRTOS, LynxOS-178, VxWorks and Linux. The Tracealyzer SDK enables other OS integrations and also extensions for full-stack observability. The Bare-Metal option can be used in any C/C++ project
with or without a supported RTOS kernel.
On any Processor
Tracealyzer supports many processor families, including STM32, NXP i.MX RT, Xilinx Zynq and other Arm devices, ESP32 and others. Tracealyzer is commonly used on 32-bit microcontrollers, 64-bit multicore SoCs and everything in between.
With any Development Tool
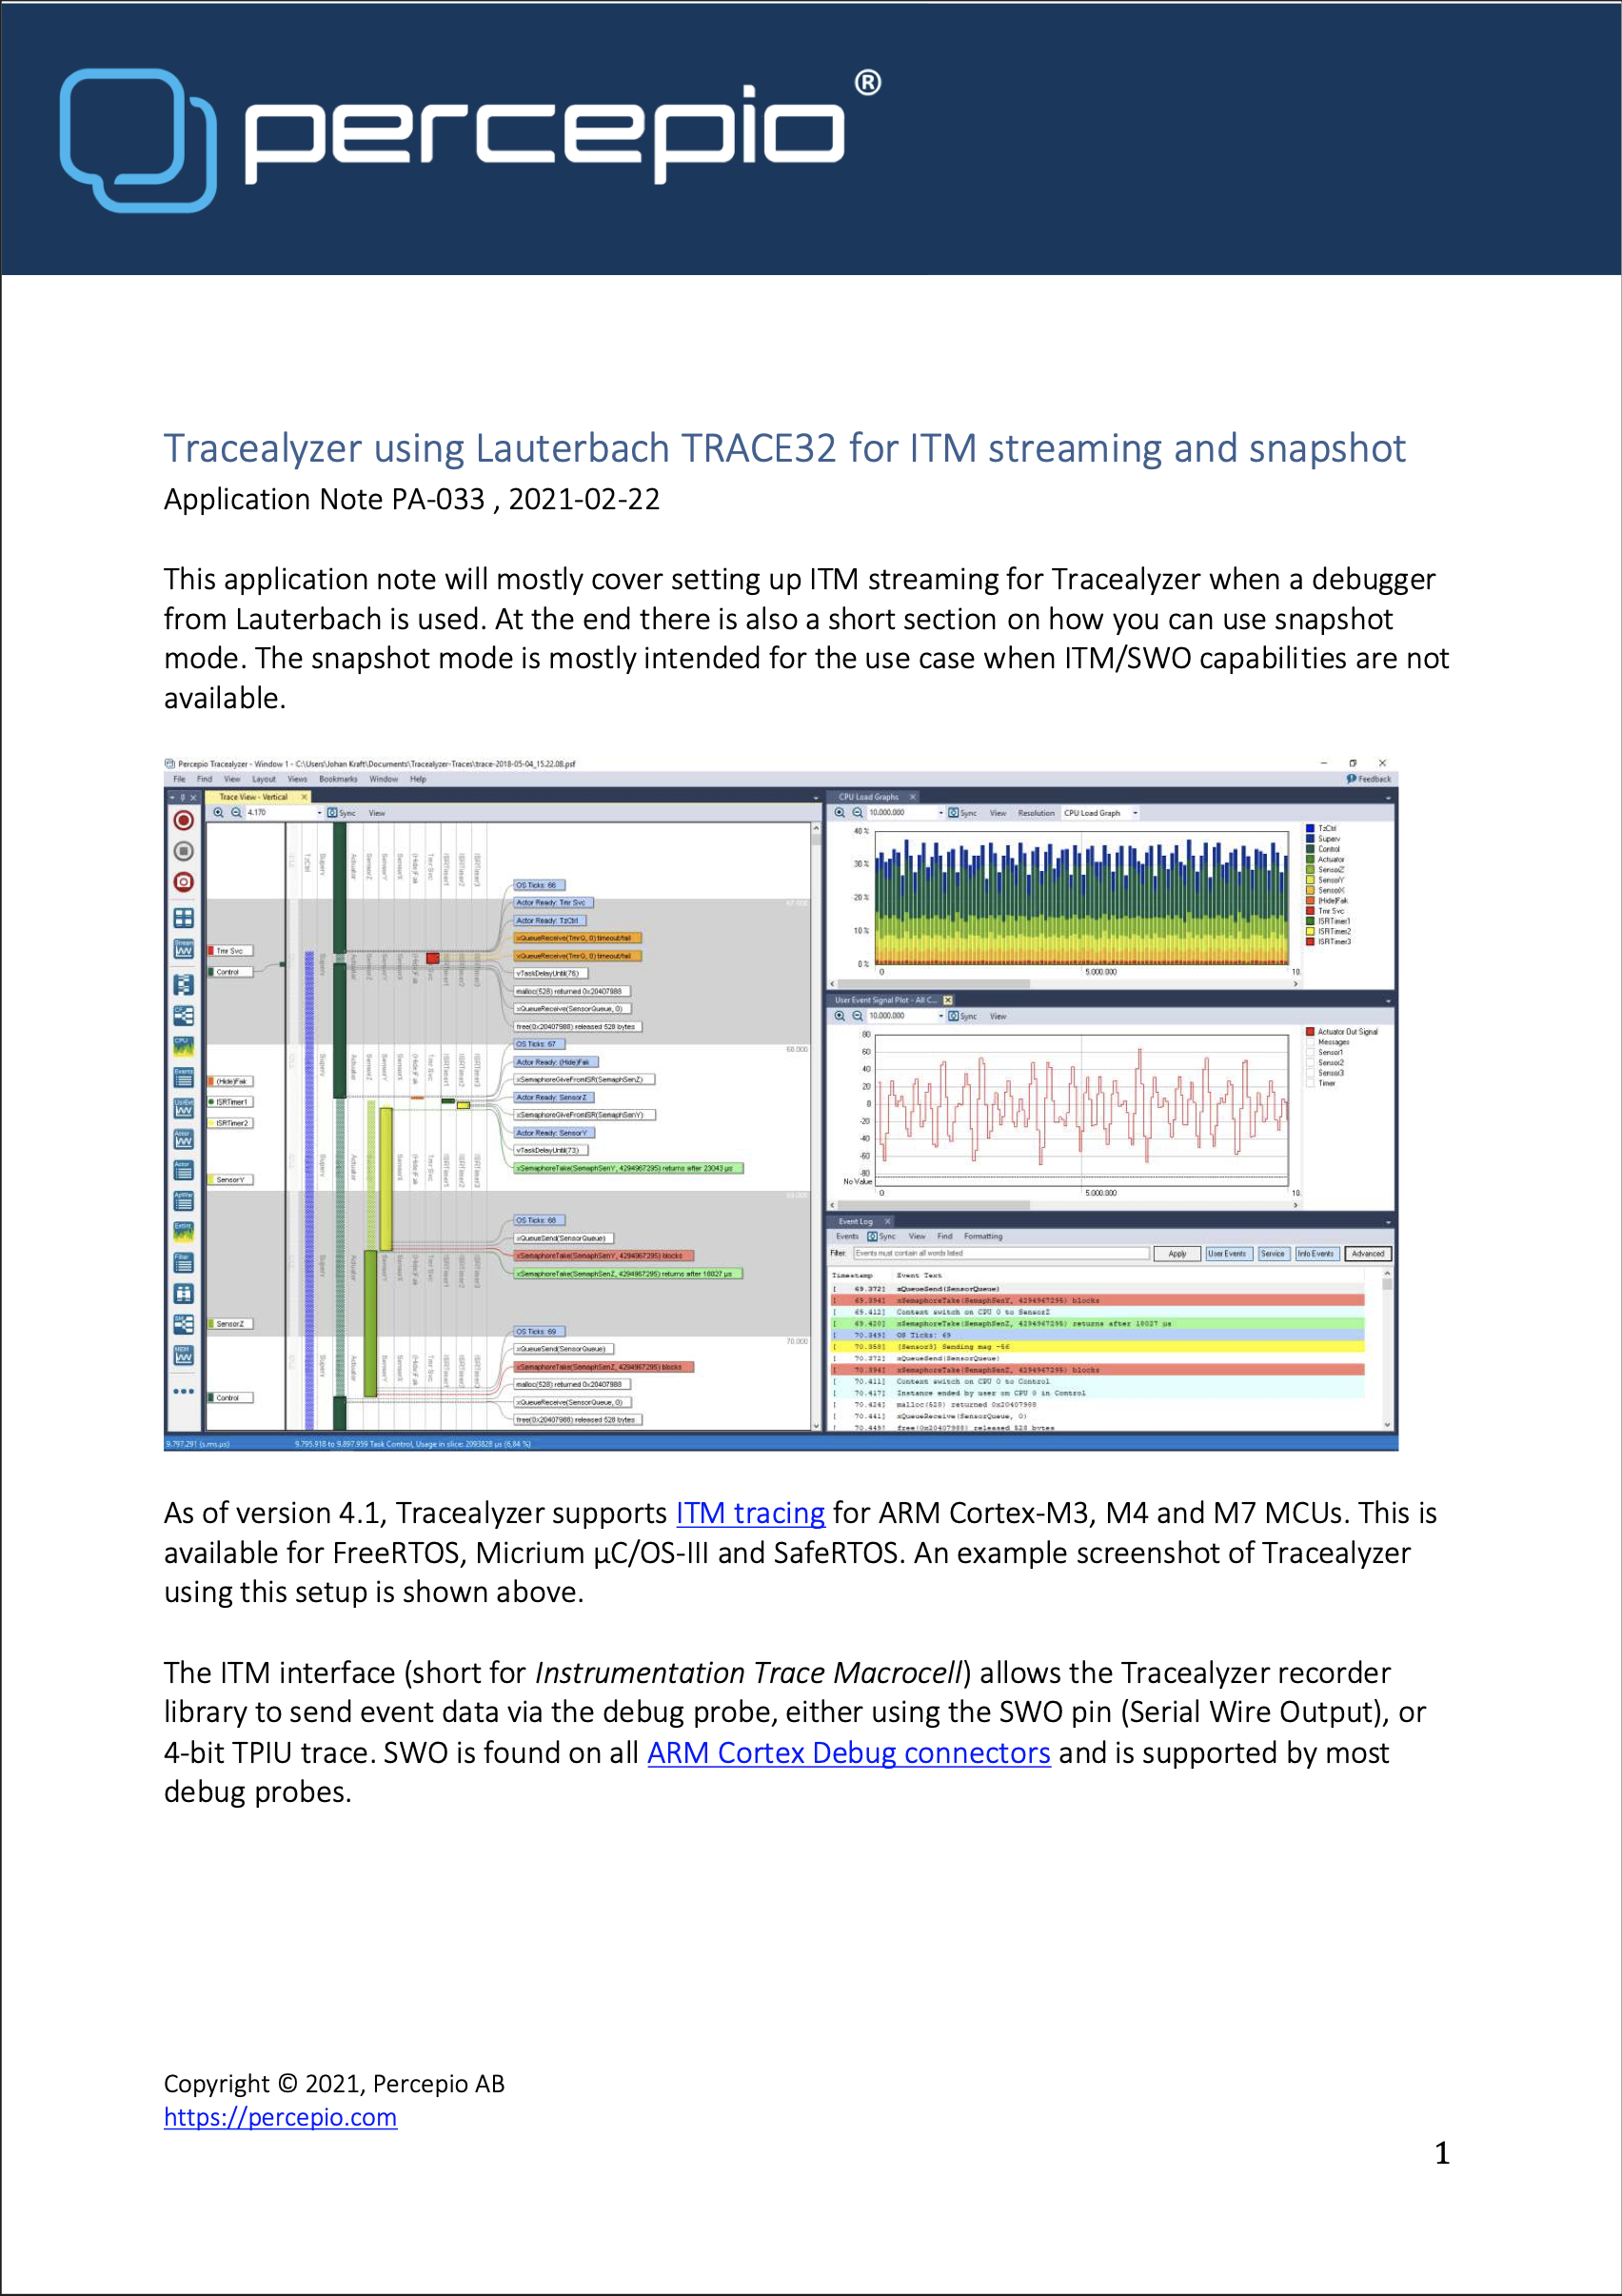
Tracealyzer can be used with any compiler, including GCC, Clang and IAR Embedded Workbench. Specific guides and debugger support are available for Arm Keil µVision, IAR, SEGGER J-Link, STM32CubeIDE, Espressif ESP-IDF and Lauterbach.
Learn more
New to Tracealyzer?
Start with our introduction to understand how visual runtime analysis works and how Tracealyzer fits into Continuous Observability.
Services & Support
Evaluation Software
NEWSLETTER & Training
Update: October 22th, 2026
© 2026 Carnica Technology. All Rights Reserved. Contact Us · Legal & Privacy